 Tokely
Research scope: This study is a snapshot: the 21 evaluations listed on the Artificial Analysis Intelligence Benchmarking methodology page on November 3, 2026, coded by Tokely to the 41 Generalized Work Activities in O*NET 31.0. It measures which work activities the evaluations test, not how well any model performs them, and occupations are not weighted by employment.
THE SHORT ANSWER
The Artificial Analysis Intelligence Index tests 8 of 41 O*NET work activities and puts 73% of its weight on three of them. Across all 21 evaluations listed on its methodology page, coverage widens to 13 of 41 activities. This leaves what we call the colleague gap, where communicating with supervisors, peers or subordinates is rated very important (4 or higher on O*NET's 1 to 5 importance scale) in 541 of 911 occupations, yet 0 of 21 evaluations test it.
What did we measure?
The US Department of Labor catalogs occupational requirements across the economy using the O*NET 31.0 database. O*NET rates 41 Generalized Work Activities on a 1 to 5 scale of importance for each occupation. These activities span the full spectrum of labor, running from Getting Information to Operating Vehicles, Mechanized Devices, or Equipment. 911 occupations have ratings for all 41 activities.
Among those 911 occupations, 862 have at least one activity rated 4 or higher on the 5-point scale. We define any activity with an importance score of 4 or higher as a core activity for that occupation.
To evaluate benchmark coverage against these workplace definitions, we examined the Artificial Analysis leaderboard as published on November 3, 2026. Their methodology page tracks 21 distinct evaluations. Nine of these evaluations constitute the composite Intelligence Index v5.0, while the remaining 12 evaluations are tracked and reported as standalone benchmarks.
The nine evaluations in the Intelligence Index v5.0 carry specific weights. AA-Briefcase accounts for 15%, FrontierCode 2.0 holds 15%, Terminal-Bench-Science takes 15%, and AA-Omniscience represents 15%. Terminal-Bench 4.0, CritPt v2 hard subset, and HLE-Diamond carry 10% each. AutomationBench-AA and GDP.pdf contribute 5% apiece to complete the composite score.
The 12 standalone evaluations address specialized domains and task setups outside the composite index. This group consists of GDPval-AA, Harvey LAB-AA, APEX-Agents-AA, AA-AnalystAgent, EnterpriseOps-Gym-AA, and ITBench-AA. It also includes Code2Video-AA, MLCR-AA, HealthBench, IFBench, Global-MMLU-Lite, and MMMU Pro.
We coded each of the 21 evaluations to between one and four O*NET work activities based directly on what its graded output depends on. For example, FrontierCode 2.0 asks models to generate mergeable changes for real open-source software repositories. Because passing requires writing functional software and resolving bugs, FrontierCode 2.0 maps to Working with Computers and Making Decisions and Solving Problems.
Finding 1: The Intelligence Index tests 8 of 41 work activities
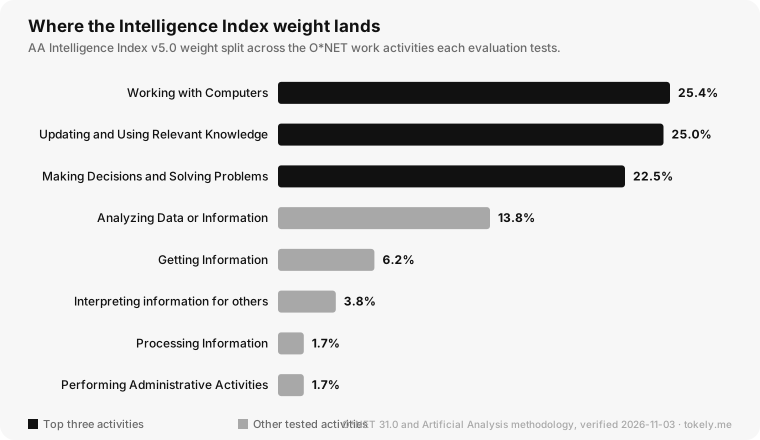
The Artificial Analysis Intelligence Index concentrates 72.9% of its total weight on just three work activities. Working with Computers claims 25.4% of the index weight. Updating and Using Relevant Knowledge receives 25.0%, and Making Decisions and Solving Problems accounts for 22.5%.
The remaining 27.1% of the index distributes thinly across five other activities. Analyzing Data or Information takes 13.8% of the total index weight. Getting Information accounts for 6.3%, while Interpreting the Meaning of Information for Others captures 3.8%. Processing Information and Performing Administrative Activities take 1.7% each.
The other 33 Generalized Work Activities receive 0% weight in the index. None of the index evaluations is coded to physical work, to caring for people or to communicating with coworkers or the public. For a team deploying models based solely on the composite index, the leaderboard reflects performance on eight specific knowledge and software activities.
Finding 2: The colleague gap
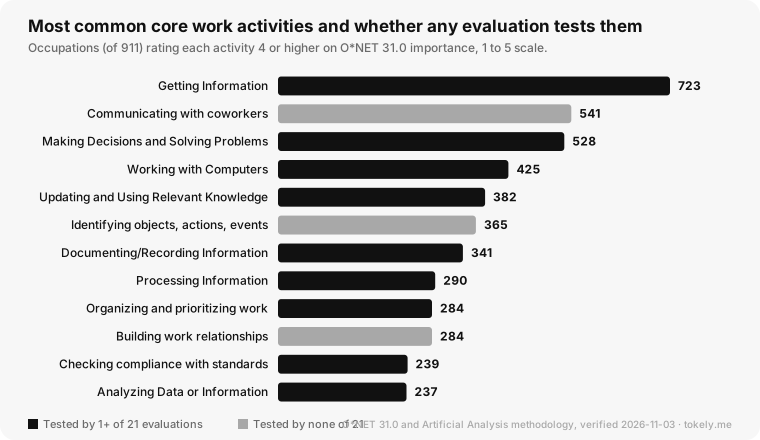
The data reveals a stark division that we call the colleague gap: communicating with supervisors, peers or subordinates is rated very important (4 or higher on O*NET's 1 to 5 importance scale) in 541 of 911 occupations, the second most common core activity after getting information (723), yet none of the 21 evaluations tests it.
A comparison of core activities highlights this mismatch across occupations. Getting Information leads the entire database as a core activity in 723 occupations and is tested by five evaluations. Communicating with Supervisors, Peers, or Subordinates follows in 541 occupations, but zero evaluations grade it. Making Decisions and Solving Problems is core in 528 occupations and tested by five evaluations.
Other frequent core activities show similar patterns of coverage or absence. Working with Computers is core in 425 occupations and tested by 11 evaluations. Updating and Using Relevant Knowledge is core in 382 occupations and covered by five tests. In contrast, Identifying Objects, Actions, and Events is core in 365 occupations, yet zero evaluations measure it.
Documenting/Recording Information is core in 341 occupations and appears in only one evaluation. Establishing and Maintaining Interpersonal Relationships is core in 284 occupations, yet zero evaluations test it. Customer Service Representatives rate coworker communication as their single most important activity, scoring it at 4.59 out of 5.
Current AI evaluations score a finished file, answer, or code change. None of the 21 evaluations grades how an agent reports to, asks, or hands off work to people inside a team.
Finding 3: Coverage follows the job family
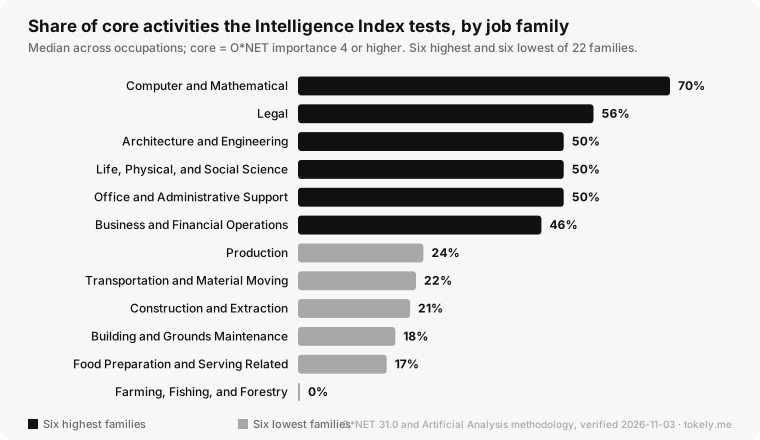
Benchmark coverage concentrates heavily in technical and desk-bound occupations. For each occupation, we computed the share of its core activities that at least one Intelligence Index evaluation tests, then took the median by job family across the 22 Standard Occupational Classification major groups. Computer and Mathematical occupations top the rankings with a median coverage of 70%.
Professional desk jobs follow right behind the software sector. Legal occupations post a median core activity coverage of 56%. Architecture and Engineering, Life, Physical, and Social Science, and Office and Administrative Support each sit at a median of 50%. Business and Financial Operations records a median coverage score of 46%.
Healthcare Practitioners and Technical occupations sit in the middle at 40%. Manual, trade and service families sit at the bottom: Production occupations drop to 24%, while Transportation and Material Moving sits at 22%. Construction and Extraction posts 21%, Building and Grounds Cleaning and Maintenance reaches 18%, Food Preparation and Serving Related scores 17%, and Farming, Fishing, and Forestry records 0%.
Individual occupations illustrate how these disparities play out in practice. For Software Developers, the index tests six of their nine core activities. For Registered Nurses, the index tests five of 17 core activities, leaving their top activity, Assisting and Caring for Others at 4.94 out of 5, completely untested. Elementary School Teachers see only one of five core activities tested, with their top activity of Training and Teaching Others omitted.
Finding 4: Adding 12 standalone evaluations widens coverage to 13 activities
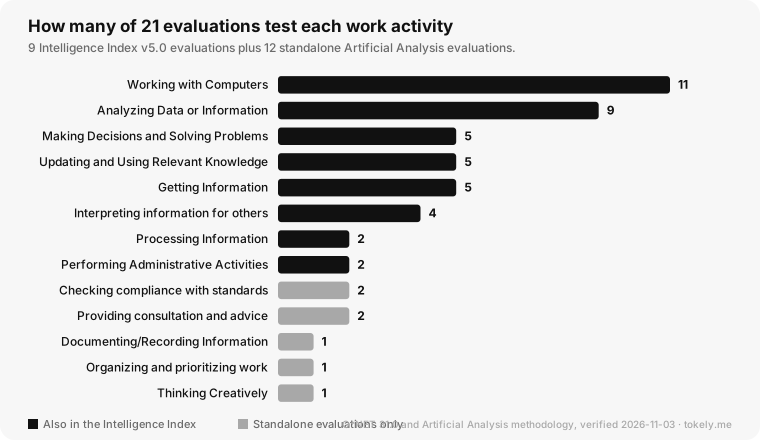
Looking beyond the composite index expands the scope of evaluated work. Combining all 21 evaluations across the methodology page brings total coverage to 13 of the 41 work activities. Even with this expanded suite, 28 work activities remain completely untested by any evaluation on the page.
The existing evaluations double down on familiar digital tasks. Working with Computers is tested by 11 of the 21 evaluations, making it the most frequently evaluated activity in the set. Analyzing Data or Information is tested by nine evaluations, reinforcing the focus on analytical processing.
The 12 standalone evaluations introduce coverage for five additional activities. Harvey LAB-AA and MLCR-AA add Evaluating Information to Determine Compliance with Standards. Harvey LAB-AA also adds Documenting/Recording Information. EnterpriseOps-Gym-AA adds Organizing, Planning, and Prioritizing Work, Code2Video-AA adds Thinking Creatively, and APEX-Agents-AA along with HealthBench adds Providing Consultation and Advice to Others.
These additions lift coverage across occupations. The median occupation goes from 37.5% of core activities tested under the index alone to 54.2% across all 21 benchmarks. Occupations with more than half of their core activities tested go from 193 to 446 of 862.
The expanded suite reduces but does not eliminate zero-coverage jobs. The number of occupations with none of their core activities tested drops from 92 to 81. When examining the single most important activity for an occupation, the Intelligence Index tests the top activity for 373 of 911 occupations, and adding the standalone evaluations raises that total to 463.
How does this compare with Mercor's benchmark map?
Our findings align with external research on benchmark scope. In October 2026, Mercor published its Benchmark Map at mercor.com/research/labor-index/benchmark-map. Mercor mapped prompts from 29 selected benchmarks against 18,797 O*NET tasks across 923 occupations using an LLM judge.
Mercor defined a task as covered at five or more prompts, and it weighted its results by estimated working time. It reports that 208 of 923 occupations have a covered task, and that about 90% of US working hours go to tasks with little or no benchmark coverage. That is Mercor's result, not ours.
Our study is coarser, examining 41 Generalized Work Activities instead of 18,797 tasks. We also used the evaluations a popular public leaderboard actually runs, rather than a list of benchmarks selected for economic relevance.
Despite these differences in method and granularity, both studies point the same way. Evaluation coverage is deep in computer, legal, and analytical work. At the same time, coverage is thin in physical, interpersonal, and hands-on work.
What this means when you pick a model
A leaderboard score mostly tells you how a model does on computer work, recall of knowledge, and solving well-defined problems. If your product writes code, analyzes documents, or answers expert questions, the Intelligence Index is measuring close to your use case.
The leaderboard offers much less insight for products that handle collaborative or interactive tasks. If your product handles customer conversations, team handoffs, scheduling, or anything physical, run your own evaluation on your own tasks, because none of the 21 evaluations scores those activities. A model leading the public leaderboard might not show an advantage on unmeasured coordination tasks.
An internal test set built from your own tasks shows whether a model asks clarifying questions, respects user constraints and fits the way your team hands off work. Tokely gives one API key for many models, which makes running the same task set across several models cheap to set up.
Methodology and limitations
Our analysis relies on the O*NET 31.0 Work Activities file, which provides importance ratings for 41 Generalized Work Activities; 911 occupations have all 41 rated. We downloaded this dataset directly from onetcenter.org on November 3, 2026. On the evaluation side, we extracted the list of active evaluations from the Artificial Analysis methodology page on November 3, 2026, referencing the evaluation papers and announcements linked in the CSV.
Coding was done by one Tokely analyst at the activity level, from each evaluation's published description, and is a judgment call. A stricter or looser coder would move individual activities between categories. Because our goal was assessing general alignment, we evaluated benchmarks at the level of broad work activities rather than individual prompt statements.
Occupations are not weighted by employment, so the medians describe the typical O*NET occupation, not the typical worker. Ties for an occupation's top activity are resolved in O*NET element order. In addition, an activity counts as tested if at least one evaluation targets it, regardless of how many tasks or how hard they are.
The data is a snapshot of one leaderboard's evaluation list on November 3, 2026. Benchmark providers update their rosters, and new evaluations appear over time. These numbers describe that one evaluation list at the time of the snapshot, not every benchmark in use.
Download the data
We have published the underlying mapping data in two CSV files. The first file contains the evaluation-to-activity map covering 21 evaluations, index weight, task format, O*NET activity, source URL, and verification date. The second file provides per-activity coverage details across all 41 activities, occupations rating each 4 or higher, mean importance, evaluations testing it, and index weight.
We make both datasets freely available for developer research. Cite as: Tokely, "Do AI Benchmarks Measure Real Work? 21 Leaderboard Evaluations Mapped to 41 O*NET Work Activities", November 2026, https://tokely.me/blog/ai-benchmarks-vs-real-work-2026.